Páčia sa vám dashboardy v Grafane? Radi by ste mali väčší prehľad o vašej vSphere infraštruktúre? Tento návod vás prevedie inštaláciou Grafany, Telegrafu, InfluxDB aj importom samotného dashboardu.
Ak hľadáte prehľadné zobrazenie stavu vašeho vSphere prostredia, Jorge De La Cruz vyrobil veľmi pekný dashboard pre Grafanu. V tomto článku si ukážeme, ako nainštalovať Grafanu, kolektor zbieraných metrík Telegraf a InfluxDB. Telegraf zozbiera metriky (v našom prípade z vCentra), uloží ich do databázy časových radov (TSDB) InfluxDB a uložené dáta nám v peknom formáte zobrazí Grafana.

Grafana
V prvom rade si nainštalujeme VMku s Ubuntu. V mojom prípade to je Ubuntu Server 20.10. Ak si ju inštalujeme sami, nakonfigurujme si statickú IP a doinštalujme OpenSSH server. Aby sme nemuseli využívať VMware konzolu. Ak nám tento Linux pripraví náš kolega, poprosíme ho aby nás pridal medzi sudoers.
Ak už máme server pripravený, zadajme postupne tento sled príkazov:
sudo apt-get install -y apt-transport-https
sudo apt-get install -y software-properties-common wget
wget -q -O - https://packages.grafana.com/gpg.key | sudo apt-key add -
echo "deb https://packages.grafana.com/oss/deb stable main" | sudo tee -a /etc[slash]apt/sources.list.d/grafana.list
sudo apt-get update
sudo apt-get install grafana
sudo systemctl daemon-reload
sudo systemctl start grafana-server
Pre kontrolu stavu Grafany použijeme nasledujúci príkaz:
sudo systemctl status grafana-server
Aby sa nám Grafana naštartovala po reštarte servera automaticky, potrebujeme spustiť:
sudo systemctl enable grafana-server.service
InfluxDB
Keď už máme Grafanu nainštalovanú, budeme pokračovať inštaláciou InfluxDB.
echo "deb https://repos.influxdata.com/ubuntu bionic stable" | sudo tee /etc[slash]apt/sources.list.d/influxdb.list

sudo curl -sL https://repos.influxdata.com/influxdb.key | sudo apt-key add -

sudo apt-get update

sudo apt-get install influxdb

sudo systemctl enable --now influxdb
Pre kontrolu, či nám InfluxDB beží správne, použijeme opäť príkaz systemctl status
systemctl status influxdb
V našom prípade tu môžeme skončiť. Ak by sme však chceli zapnúť autentifikáciu, musíme tak urobiť v súbore /etc[slash]influxdb/influxdb.conf
[http]
auth-enabled = true
Následne budeme potrebovať reštartovať InfluxDB
sudo systemctl restart influxdb
a vyrobiť uživateľa s heslom
curl -XPOST "<a class="vglnk" href="http://localhost:8086/query" \
--data-urlencode "q=CREATE USER <uzivatelske_meno>; WITH PASSWORD '<silne_heslo>' WITH ALL PRIVILEGES"
Telegraf
Posledným krokom pred samotným importom dashboardu je inštalácia a konfigurácia Telegrafu.
sudo apt-get -y install telegraf
Konfigurácia pozostáva z editácie /etc[slash]telegraf/telegraf.conf. Napr. obľúbeným textovým editorom vi. ;-)
V sekcii [[outputs.influxdb]] odkomentujeme a zmeníme riadky nasledovne:
urls = [“http://localhost:8086”]
database = “telegraf”
timeout = “0s”
Ak by sme mali aj username a password do InfluxDB, zeditujeme aj
username = “<uzivatelske_meno>”
password = “<silne_heslo>”
Zmeny v časti [[inputs.vsphere]] by mohli vyzerať nejako takto:
# # Read metrics from VMware vCenter
[[inputs.vsphere]]
# ## List of vCenter URLs to be monitored. These three lines must be uncommented
# ## and edited for the plugin to work.
vcenters = [ “https:///sdk” ]
username = “<uzivatel@vsphere.local>”
password = “<uzivatelske_heslo>”
#
# ## VMs
# ## Typical VM metrics (if omitted or empty, all metrics are collected)
# # vm_include = [ “/*/vm/**”] # Inventory path to VMs to collect (by default all are collected)
# # vm_exclude = [] # Inventory paths to exclude
vm_metric_include = [
“cpu.demand.average”,
“cpu.idle.summation”,
“cpu.latency.average”,
“cpu.readiness.average”,
“cpu.ready.summation”,
“cpu.run.summation”,
“cpu.usagemhz.average”,
“cpu.used.summation”,
“cpu.wait.summation”,
“mem.active.average”,
“mem.granted.average”,
“mem.latency.average”,
“mem.swapin.average”,
“mem.swapinRate.average”,
“mem.swapout.average”,
“mem.swapoutRate.average”,
“mem.usage.average”,
“mem.vmmemctl.average”,
“net.bytesRx.average”,
“net.bytesTx.average”,
“net.droppedRx.summation”,
“net.droppedTx.summation”,
“net.usage.average”,
“power.power.average”,
“virtualDisk.numberReadAveraged.average”,
“virtualDisk.numberWriteAveraged.average”,
“virtualDisk.read.average”,
“virtualDisk.readOIO.latest”,
“virtualDisk.throughput.usage.average”,
“virtualDisk.totalReadLatency.average”,
“virtualDisk.totalWriteLatency.average”,
“virtualDisk.write.average”,
“virtualDisk.writeOIO.latest”,
“sys.uptime.latest”,
]
# # vm_metric_exclude = [] ## Nothing is excluded by default
# # vm_instances = true ## true by default
#
# ## Hosts
# ## Typical host metrics (if omitted or empty, all metrics are collected)
# # host_include = [ “/*/host/**”] # Inventory path to hosts to collect (by default all are collected)
# # host_exclude [] # Inventory paths to exclude
host_metric_include = [
“cpu.coreUtilization.average”,
“cpu.costop.summation”,
“cpu.demand.average”,
“cpu.idle.summation”,
“cpu.latency.average”,
“cpu.readiness.average”,
“cpu.ready.summation”,
“cpu.swapwait.summation”,
“cpu.usage.average”,
“cpu.usagemhz.average”,
“cpu.used.summation”,
“cpu.utilization.average”,
“cpu.wait.summation”,
“disk.deviceReadLatency.average”,
“disk.deviceWriteLatency.average”,
“disk.kernelReadLatency.average”,
“disk.kernelWriteLatency.average”,
“disk.numberReadAveraged.average”,
“disk.numberWriteAveraged.average”,
“disk.read.average”,
“disk.totalReadLatency.average”,
“disk.totalWriteLatency.average”,
“disk.write.average”,
“mem.active.average”,
“mem.latency.average”,
“mem.state.latest”,
“mem.swapin.average”,
“mem.swapinRate.average”,
“mem.swapout.average”,
“mem.swapoutRate.average”,
“mem.totalCapacity.average”,
“mem.usage.average”,
“mem.vmmemctl.average”,
“net.bytesRx.average”,
“net.bytesTx.average”,
“net.droppedRx.summation”,
“net.droppedTx.summation”,
“net.errorsRx.summation”,
“net.errorsTx.summation”,
“net.usage.average”,
“power.power.average”,
“storageAdapter.numberReadAveraged.average”,
“storageAdapter.numberWriteAveraged.average”,
“storageAdapter.read.average”,
“storageAdapter.write.average”,
“sys.uptime.latest”,
]
# ## Collect IP addresses? Valid values are “ipv4” and “ipv6”
# # ip_addresses = [“ipv6”, “ipv4” ]
#
# # host_metric_exclude = [] ## Nothing excluded by default
# # host_instances = true ## true by default
#
#
# ## Clusters
# #cluster_include = [ “/*/host/**”] # Inventory path to clusters to collect (by default all are collected)
# # cluster_exclude = [] # Inventory paths to exclude
cluster_metric_include = [] ## if omitted or empty, all metrics are collected
# # cluster_metric_exclude = [] ## Nothing excluded by default
# # cluster_instances = false ## false by default
#
# ## Datastores
# # datastore_include = [ “/*/datastore/**”] # Inventory path to datastores to collect (by default all are collected)
# # datastore_exclude = [] # Inventory paths to exclude
datastore_metric_include = [] ## if omitted or empty, all metrics are collected
# # datastore_metric_exclude = [] ## Nothing excluded by default
# # datastore_instances = false ## false by default
#
# ## Datacenters
# # datacenter_include = [ “/*/host/**”] # Inventory path to clusters to collect (by default all are collected)
# # datacenter_exclude = [] # Inventory paths to exclude
datacenter_metric_include = [] ## if omitted or empty, all metrics are collected
# datacenter_metric_exclude = [ “*” ] ## Datacenters are not collected by default.
# # datacenter_instances = false ## false by default
#
# ## Plugin Settings
# ## separator character to use for measurement and field names (default: “_”)
# # separator = “_”
#
# ## number of objects to retrieve per query for realtime resources (vms and hosts)
# ## set to 64 for vCenter 5.5 and 6.0 (default: 256)
# # max_query_objects = 256
#
# ## number of metrics to retrieve per query for non-realtime resources (clusters and datastores)
# ## set to 64 for vCenter 5.5 and 6.0 (default: 256)
# # max_query_metrics = 256
#
# ## number of go routines to use for collection and discovery of objects and metrics
# # collect_concurrency = 1
# # discover_concurrency = 1
#
# ## the interval before (re)discovering objects subject to metrics collection (default: 300s)
# # object_discovery_interval = “300s”
#
# ## timeout applies to any of the api request made to vcenter
# # timeout = “60s”
#
# ## When set to true, all samples are sent as integers. This makes the output
# ## data types backwards compatible with Telegraf 1.9 or lower. Normally all
# ## samples from vCenter, with the exception of percentages, are integer
# ## values, but under some conditions, some averaging takes place internally in
# ## the plugin. Setting this flag to “false” will send values as floats to
# ## preserve the full precision when averaging takes place.
# # use_int_samples = true
#
# ## Custom attributes from vCenter can be very useful for queries in order to slice the
# ## metrics along different dimension and for forming ad-hoc relationships. They are disabled
# ## by default, since they can add a considerable amount of tags to the resulting metrics. To
# ## enable, simply set custom_attribute_exclude to [] (empty set) and use custom_attribute_include
# ## to select the attributes you want to include.
# ## By default, since they can add a considerable amount of tags to the resulting metrics. To
# ## enable, simply set custom_attribute_exclude to [] (empty set) and use custom_attribute_include
# ## to select the attributes you want to include.
# # custom_attribute_include = []
# # custom_attribute_exclude = [“*”]
#
# ## Optional SSL Config
# # ssl_ca = “/path/to/cafile”
# # ssl_cert = “/path/to/certfile”
# # ssl_key = “/path/to/keyfile”
# ## Use SSL but skip chain & host verification
insecure_skip_verify = true
Poznámka: Účtu do vCenter stačia read-only práva a insecure_skip_verify ma default hodnotu false, takže ju nezabudnite zmeniť na true.
Posledné 2 príkazy, ktoré nám reštartnú Telegraf a zabezpečia spustenie Telegrafu po reštarte servera:
sudo systemctl restart telegraf

sudo systemctl enable telegraf
Pridanie InfluxDB ako “Data Source” do Grafany
Teraz našu databázu potrebujeme pridať ako dátový zdroj.
- Otvoríme si browser a načítame http://<IP_servera>:3000/
- Prihlásime sa defaultným meno a heslom admin/admin
- Grafana nás vyzve na zmenu hesla.
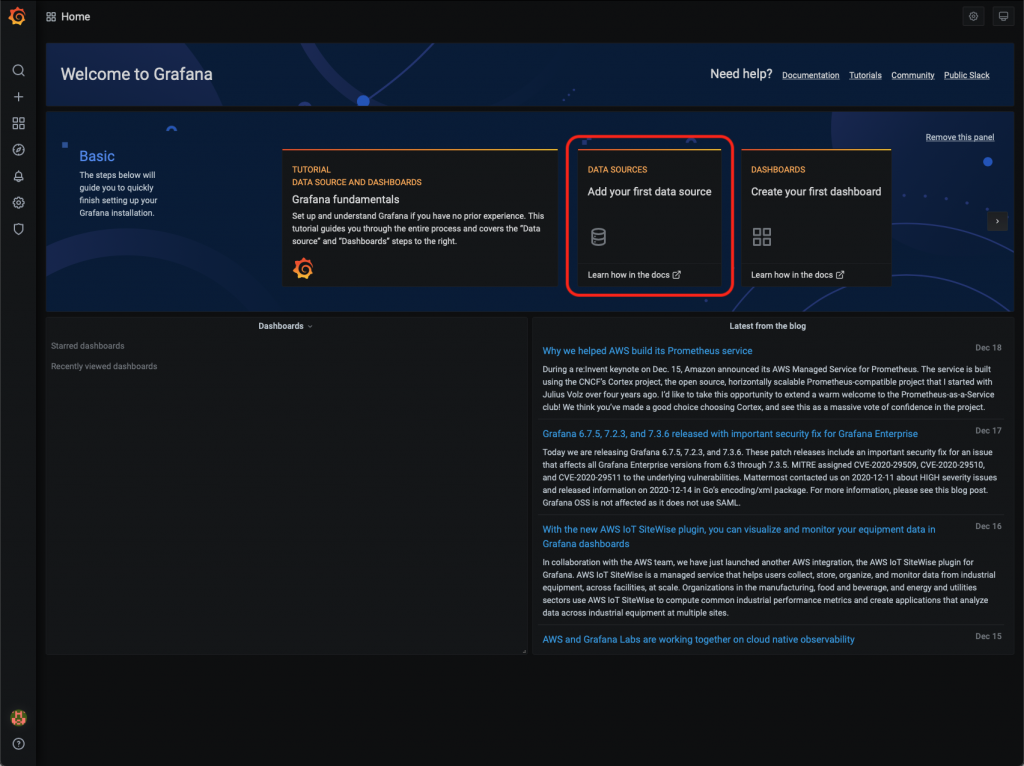
- Po úspešnej zmene sa nám zobrazí úvodná stránka.
- Klikneme teda na panel “Add your first data store”.
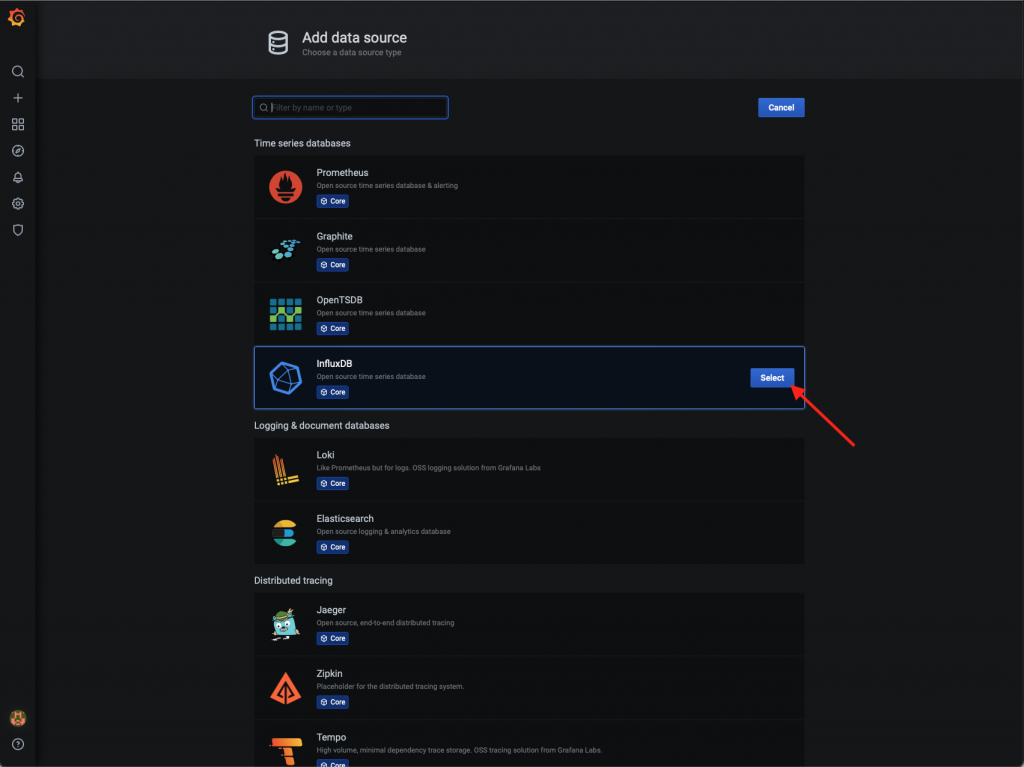
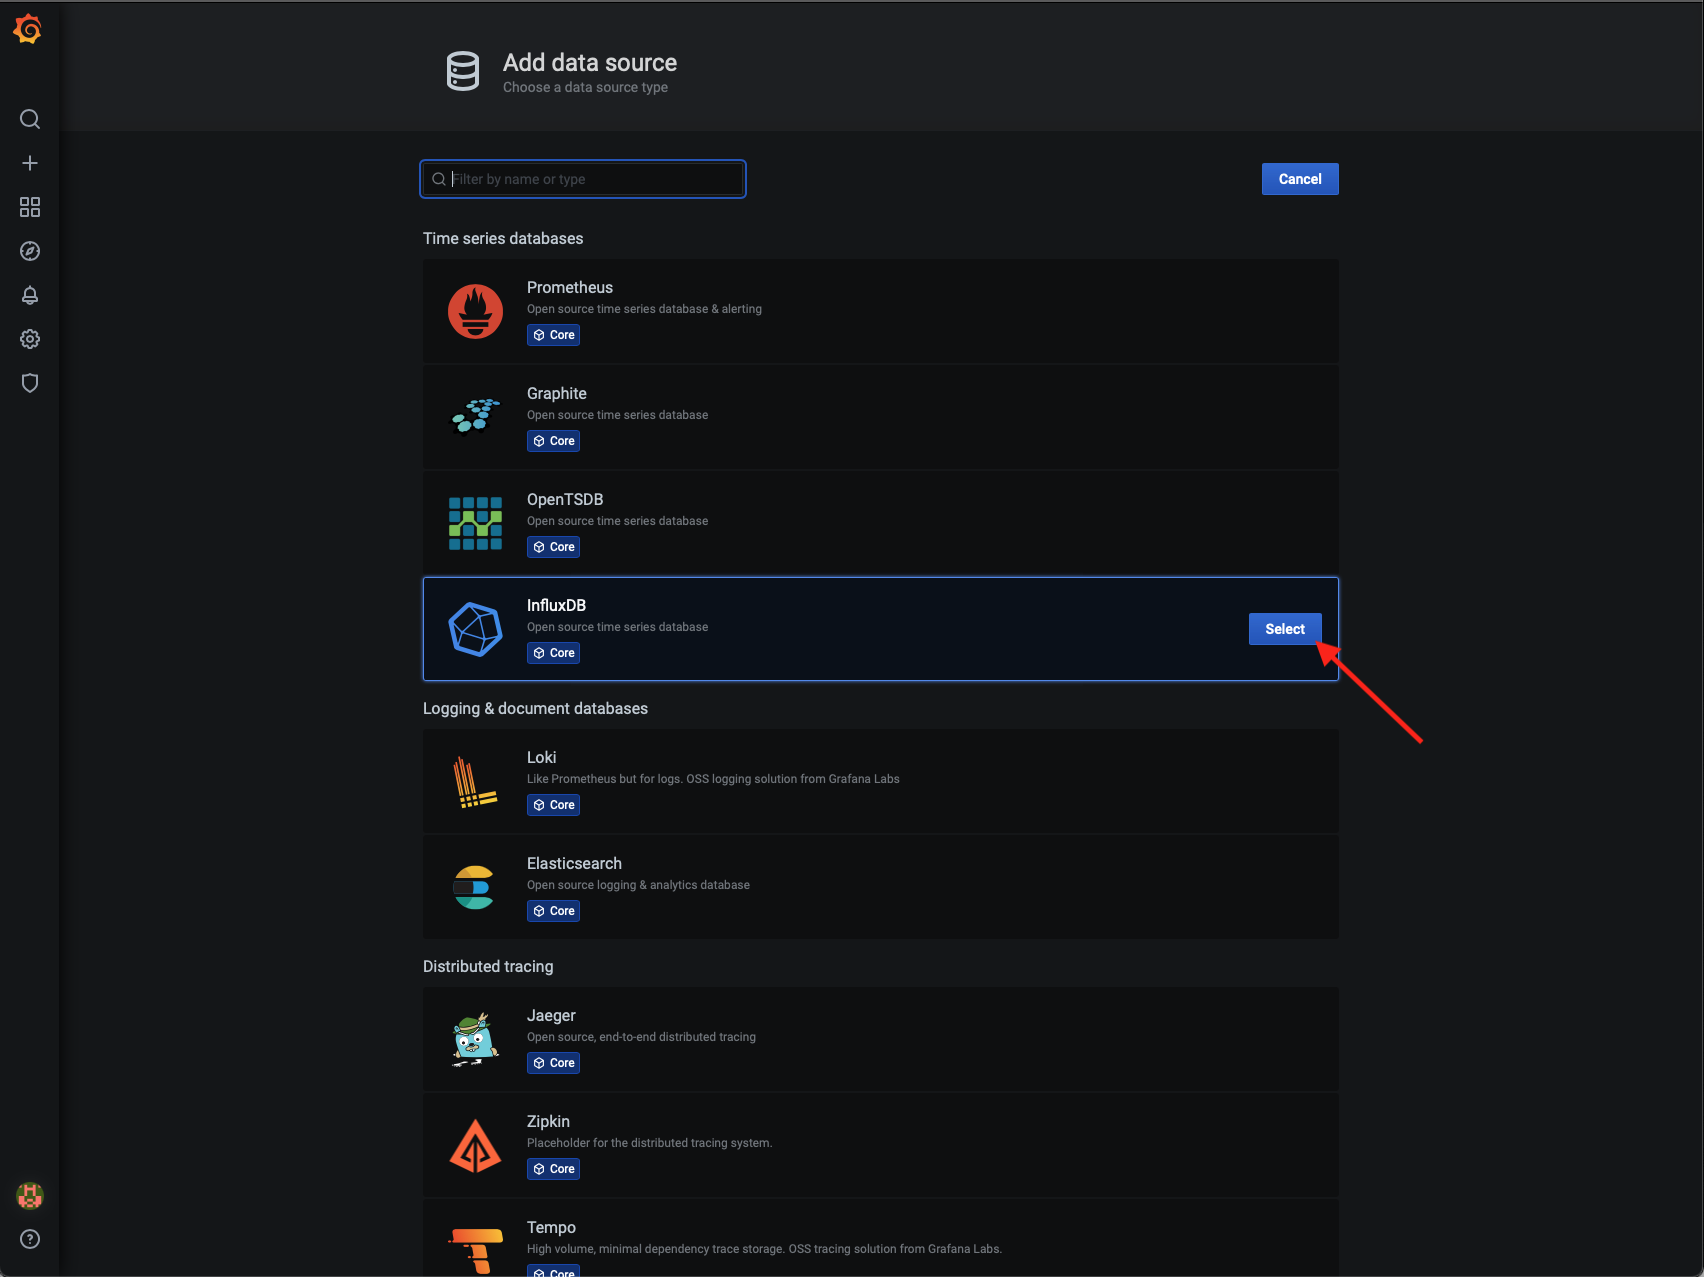
- Kliknutím na tlačidlo Select si vyberieme za zdroj dát InfluxDB.
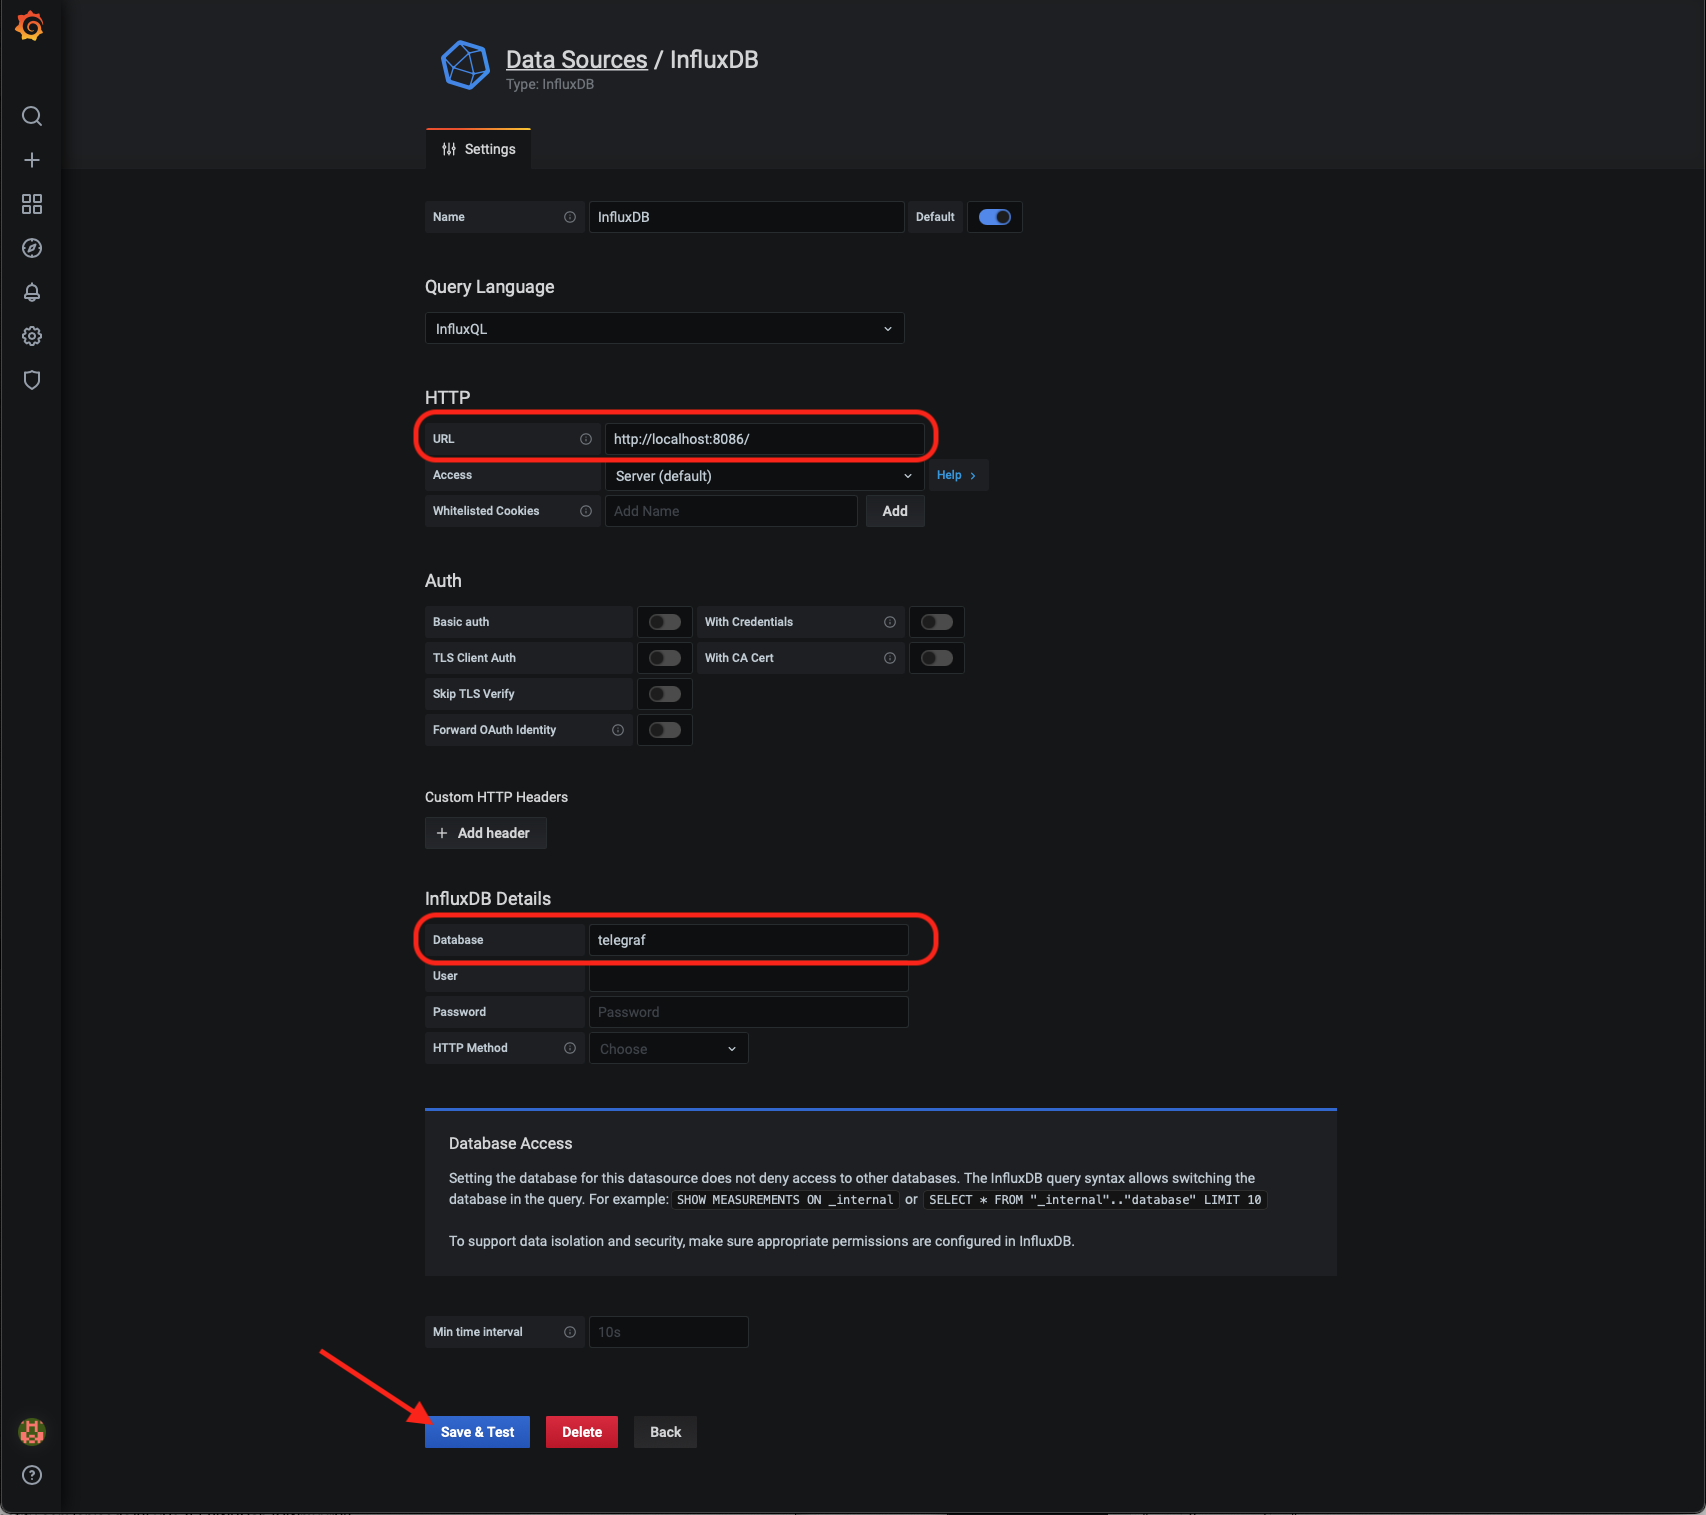
- V sekcii HTTP vyplníme ako URL http://localhost:8086/ a v sekcii InfluxDB Details databázu telegraf. Konfiguráciu potvrdíme kliknutím na tlačidlo Save & Test.
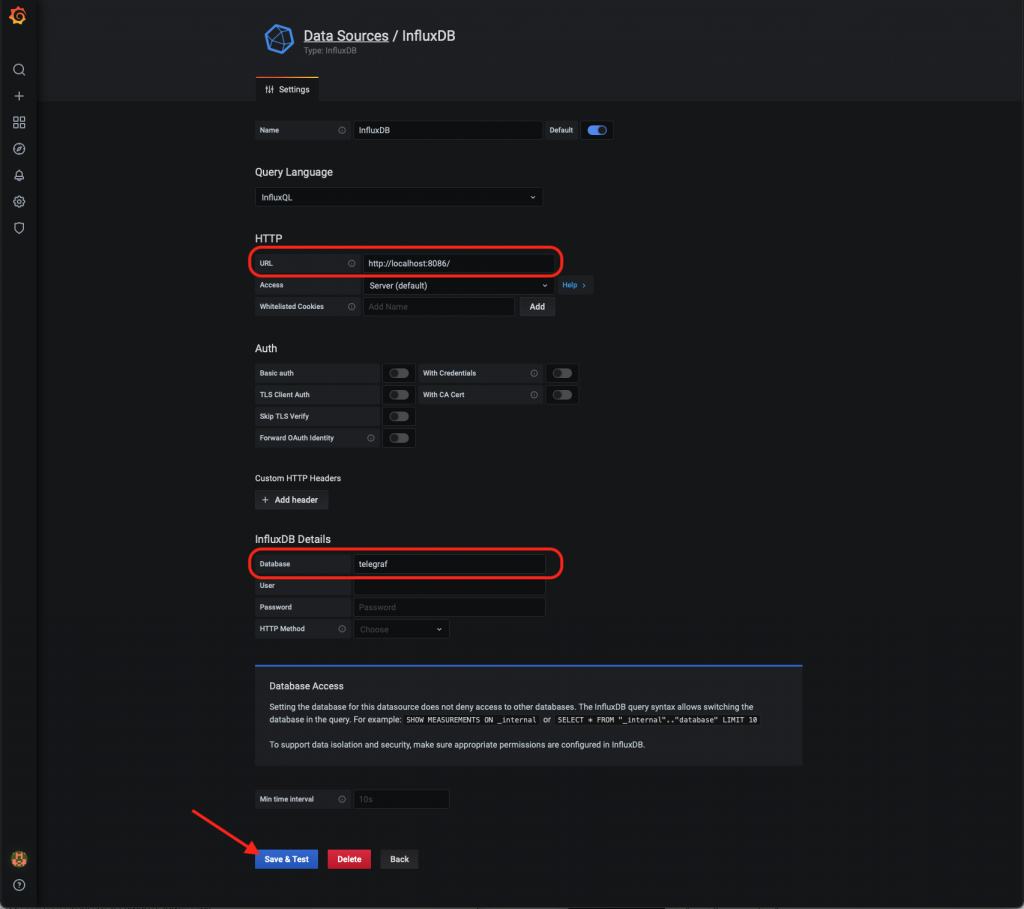
- O výsledku testu nás upovedomí hlásenie.

- InluxDB máme ako zdroj dát pridanú, môžeme prejsť na import dashboardov.

Import Grafana Dashboardu
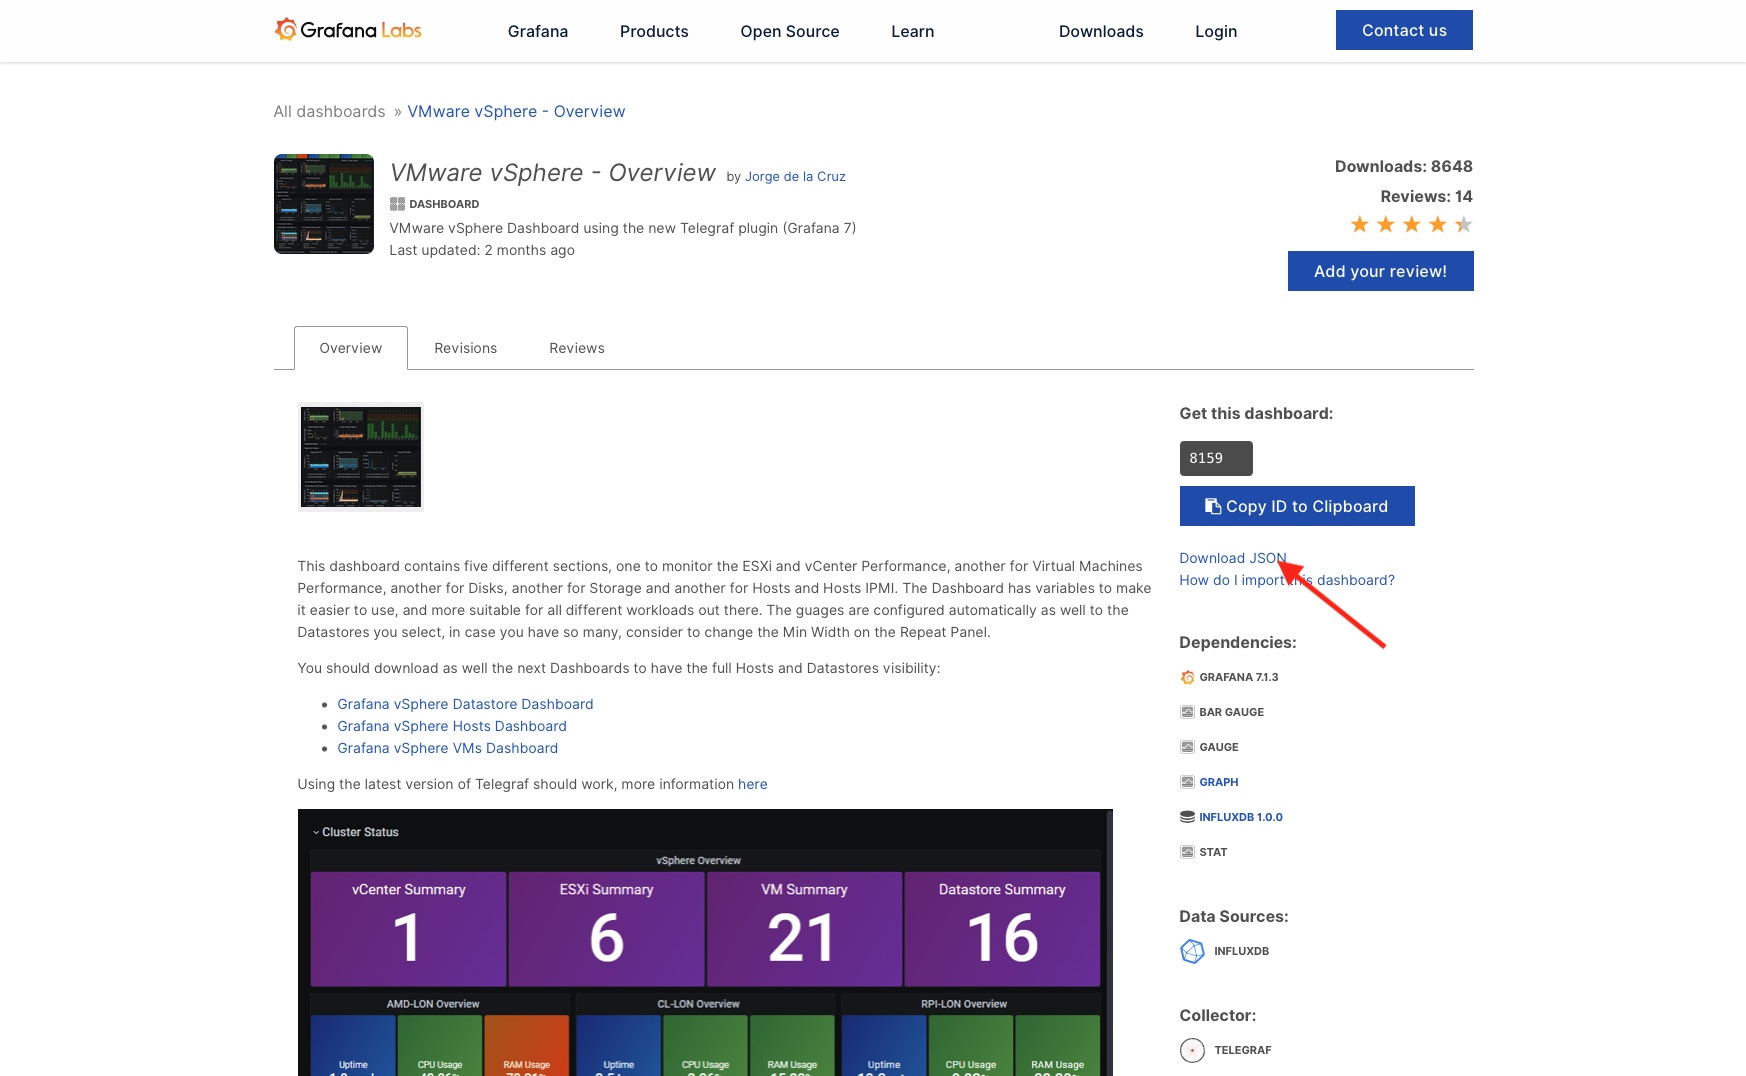
Grafana na svojich stránkach ponúka obrovské množstvo dasboardov na stiahnutie. Nás budú zaujímať konkrétne 4, ktoré vyrobil už na začiarku spomínaný Jorge De La Cruz.
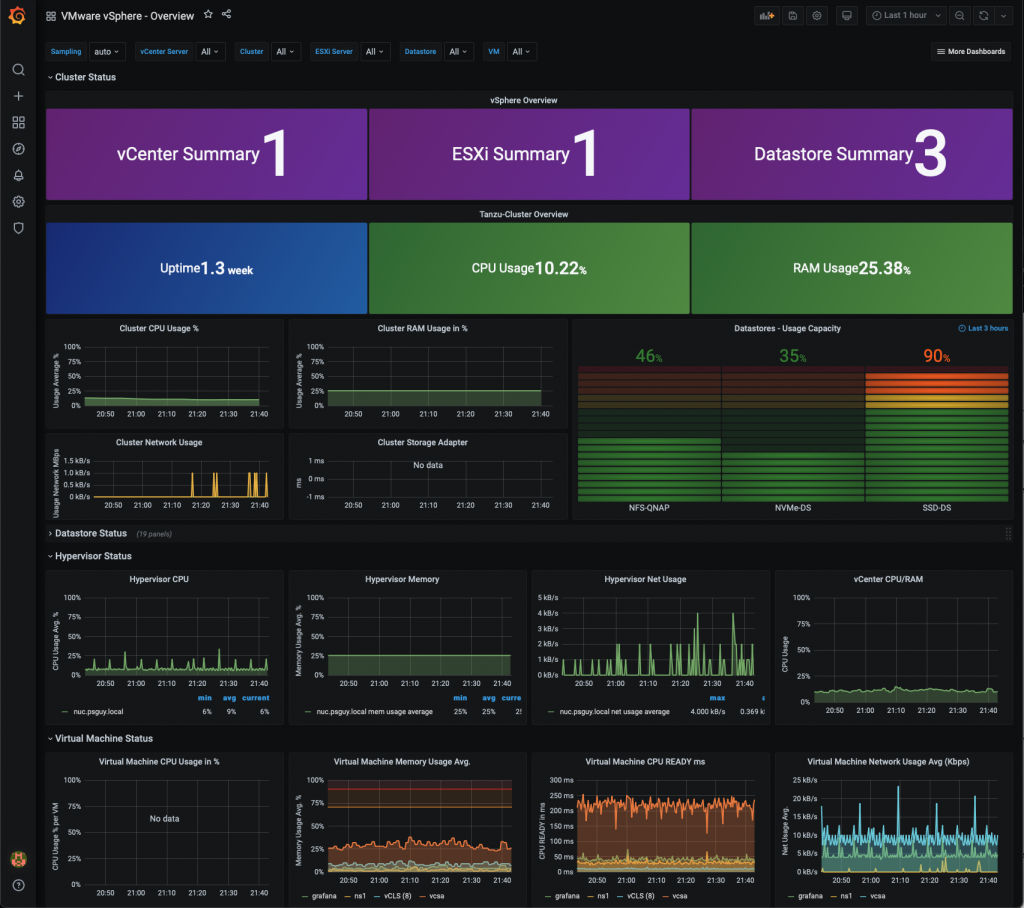
- Otvoríme si odkaz s požadovaným dashboardom. VMware vSphere – Overview a klikneme na Download JSON.

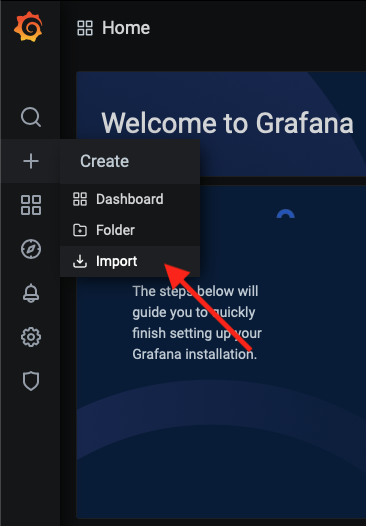
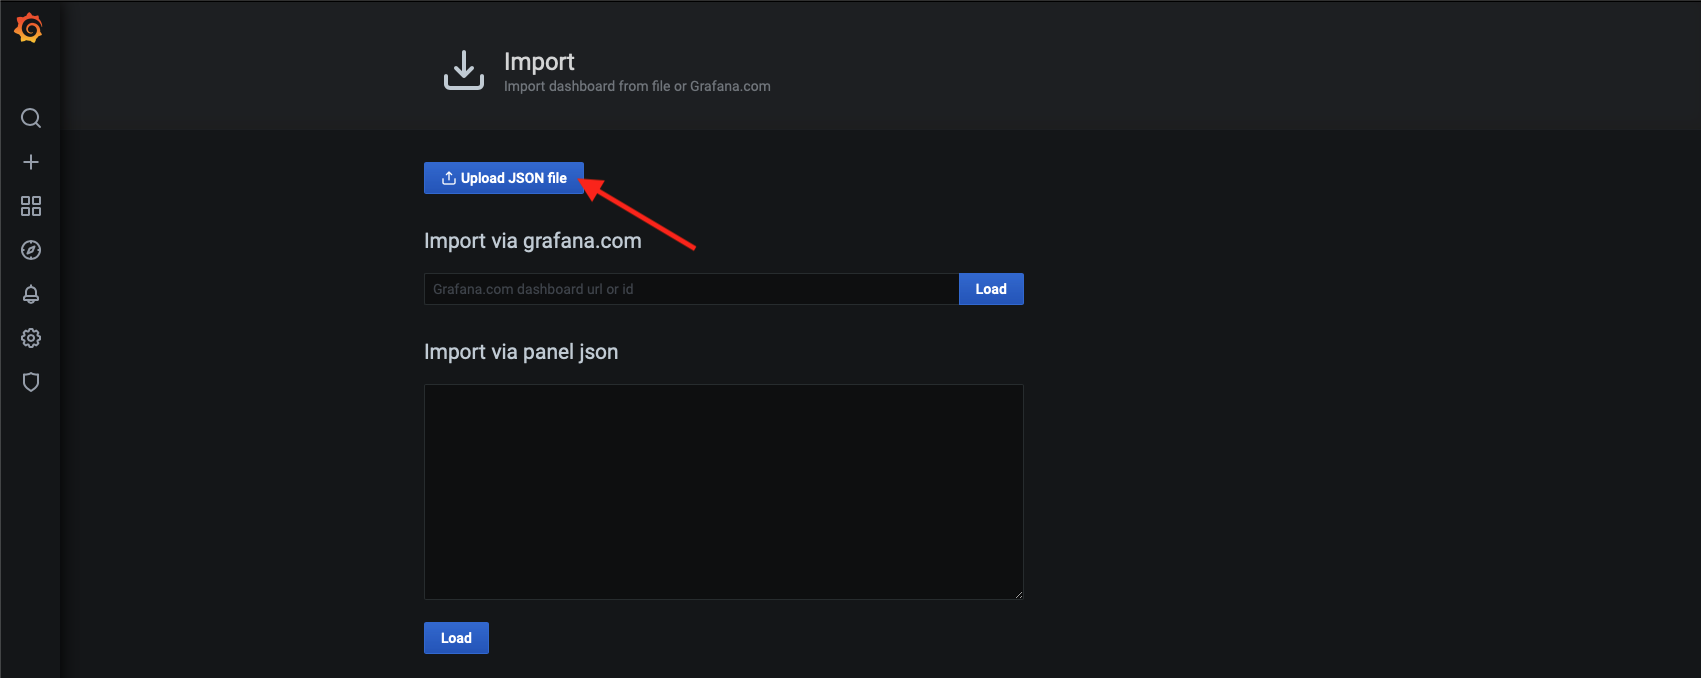
- V Grafane v ľavom menu klikneme na + a následne na Import.
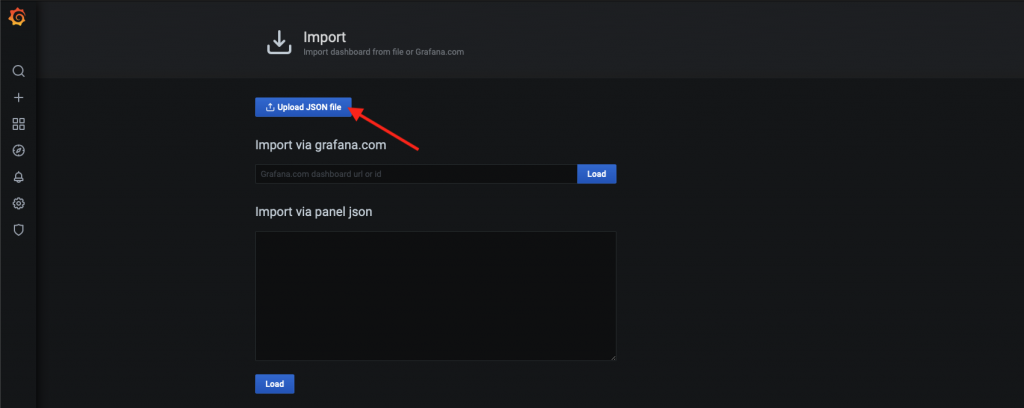
- Klikneme na tlačidlo Upload JSON file a vyberieme súbor JSON, ktorý sme stiahli v 1. kroku. Alebo do poľa Import via grafana.com vložíme link na dashboard, alebo stačí zadať číslo dashboardu, ktoré je stránke konkrétneho dashboardu.
- Vyberieme si zdroj dát. V našom prípade je to InfluxDB databáza s menom InfluxDB. Klikneme na tlačidlo Import a voir la…
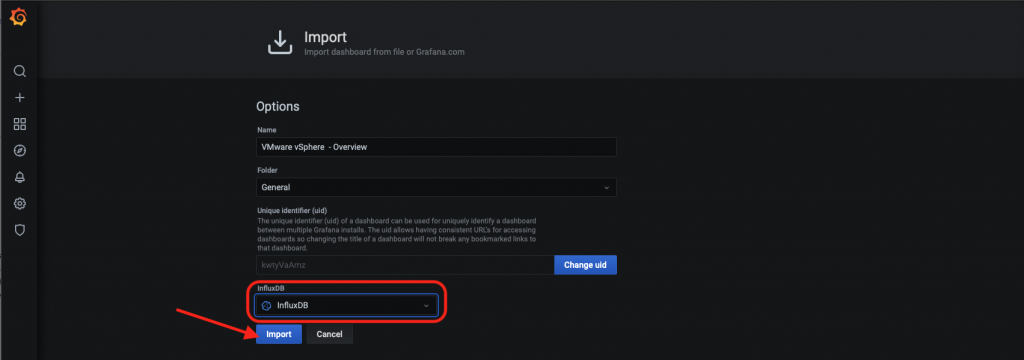
- Náš prvý dashboard. ;-)
- Rovnakým postupom môžeme pokračovat s dashboardami:

Záver
Sledovať svoju infraštruktúru práve takýmto spôsobom môže byť oveľa prínosnejšie, ako ju sledovať vo vSphere web klientovi. Pevne verím, že s týmito dashboardami získate väčší prehľad o vašich prostrediach a budete tak vedieť lepšie predchádzať prípadným problémom. Ako som už spomínal, na stránkach Grafany je dashboardov požehnane a preto dávam do pozornosti aj VEEAM dashboard 11286 alebo aj 11516. Ale o tých snáď nabudúce. ;-)